
My Parabola
Curricular Task
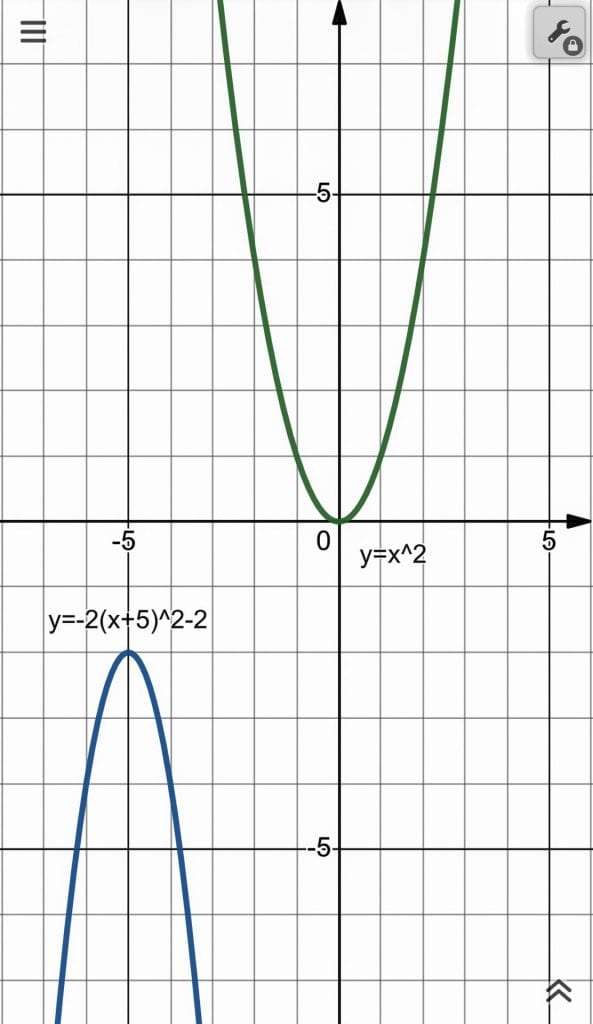
In a parabola the a value determines the shape of the parabola. My a value is -2, the negative means my parabola will open downwards. The 2 means my parabola will be thin but not wide which is when the a value is a fraction between 1 and 0. The h value determines where the vertex will be on the x-axis. My h value of -5 (written as (x- -5) or (x+5) means my parabola will be shifted 5 points to the left or into the negatives. The k value in a parabola determines where the vertex will be on the y-axis. My k value of -2 means me parabola will be shifted 2 points downwards or into the negatives.
Self Assessment
- I represented the same mathematical idea in graph form by imputing in into desmos. I can see from the equation that my graph will be downwards and the vertex will be negative. In an equation,
I was able to understand how my graph would look based on the values in my equation. In words, I represented it by explaining the significance of the a, h, and k value of my equation. - An example of where I used mathematical vocabulary in this assignment would be in my explanation of the significance of my equation. Some examples of the vocabulary I used are; Vertex, parabola, value, negative, axis, and fraction. These words demonstrate a further understanding because I could’ve used different non-mathematical words instead like; to the left, line, numbers, and thingy.
- An example in this assignment where i used formatting to share information is in my photo of the 2 parabolas, i was able to show both the parabolas in different colours and label each of the parabolas with their equation.