
Linear Equations
2x – 3y = 12
This is a linear equation.
I could tell it was a linear equation from the graph because the line that crosses across the graph is linear (straight). With the equation, however, I could tell that it was linear because it followed the format ax + by = c.
(2x) + (-3y) = 12 = ax + by = c

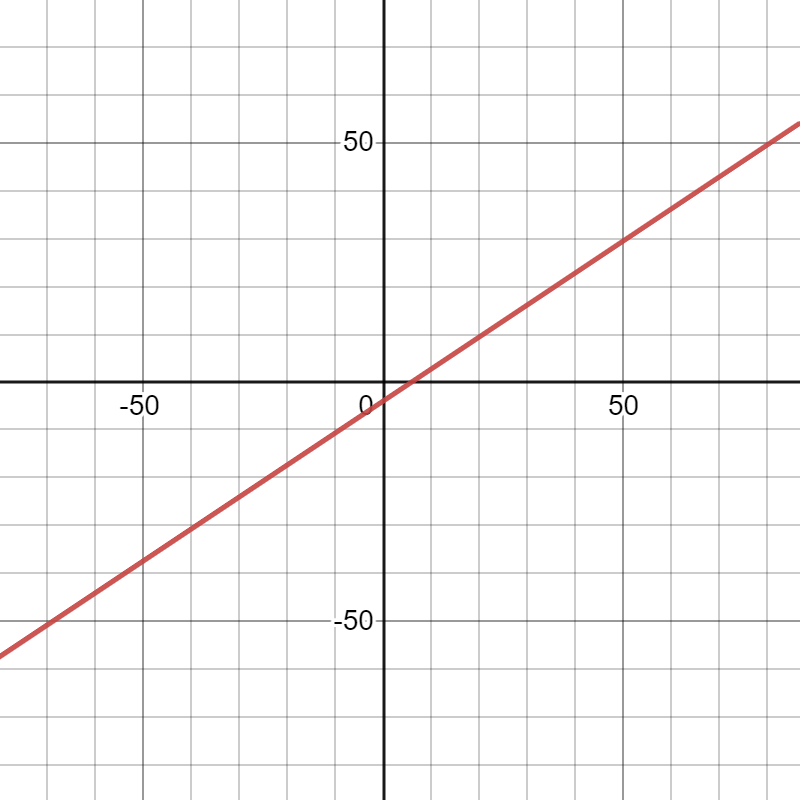
y – 3 = 4(x+1)

This is a linear equation. I could tell it was a linear equation by looking at the graph because the line that cuts across the graph is completely linear (straight).
But with the equation, I could tell it was linear because it followed the format y = mx + b. If you were to rearrange the equation shown above, it could be written as y = 4x + 7, which, if not already made clear, follows the format of y = mx + b.
y = 4x + 7 = y = mx + b
Non-Linear Equations

y = -2(x-4)2
This is a non-linear equation. I can tell that it is a non-linear by looking at the graph because the line that crosses the graph is not straight. Since the line curves on this graph, we can tell it’s not a linear equation.
With the equation, you can tell that the equation is non-linear because it doesn’t follow either ax + by = c or y = mx = b. Neither of these equations (ax + by = c, y = mx + b) have exponents, so by noting the exponent in the equation, it was immediately clear that this equation was non-linear.

y = ![]() 1/2x3
1/2x3
This is a non-linear equation. I can tell that it is non-linear by looking at the graph because the line that crosses across is not straight. (Note the imperfection in the middle.)
However, when looking at the equation, I can immediately tell that it is not a linear equation because of the exponent. Like I mentioned in the explanation for the equation above, neither of the equations that format for linear equations (ax = by = c, y = mx +b) have exponents in them, so noticing the exponent in the equation was what told me that this equation was non-linear.
Self-Reflection
I explored mathematical ideas using technology when I used DESMOS on my laptop to enter in the linear/non-linear equations. After picking the equations from teams, putting them into DESMOS helped turned them into graphs.
I analyzed data and used criteria to draw conclusions when I referred to the graphs made by DESMOS to explain why I thought it was a linear/non-linear equation.
I justified my conclusions with evidence when I used the homework sheets and textbook to check on what rules made up a linear and non-linear equation. By referring to the books and homework notes, I feel like the explanations I put for each equation ended up making more sense than if I had tried to do it on my own, without looking at the notes.