
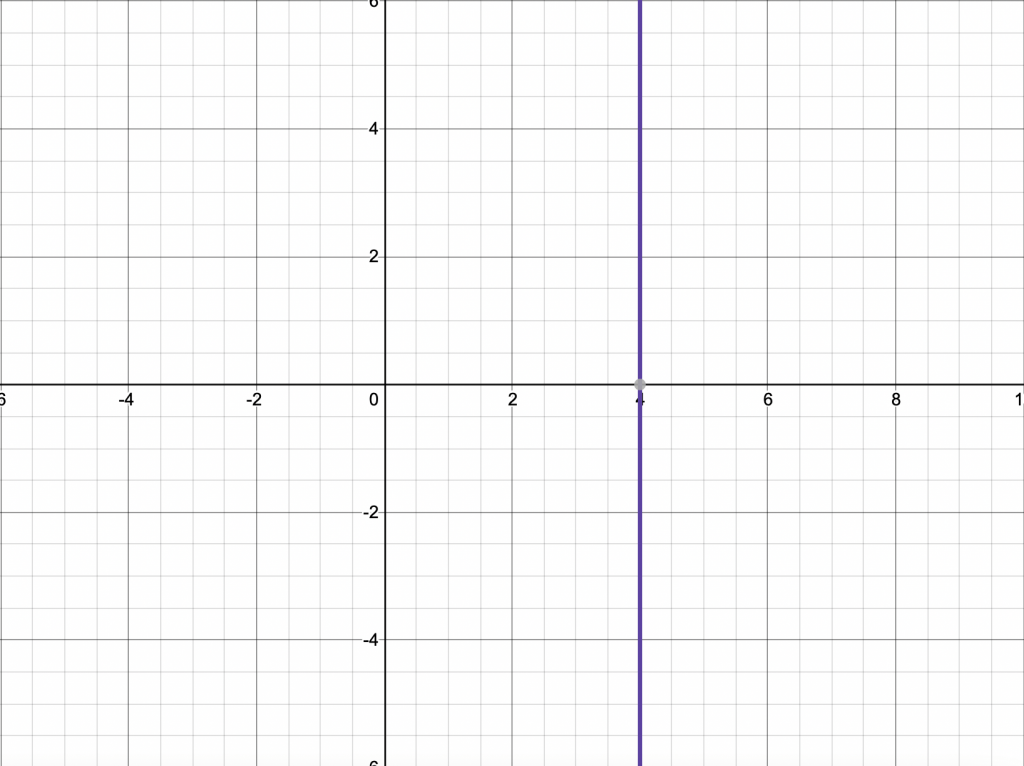
Linear
x = 4
Domain: x = 4
Range: real #
I can tell from the graph because it forms a straight line. I can tell from the equation because it is in y=mx+b form.
Linear
y = 1
Domain: real #
Range: y = 1
I can tell from the graph because it forms a straight line. I can tell from the equation because it is in y=mx+b form.

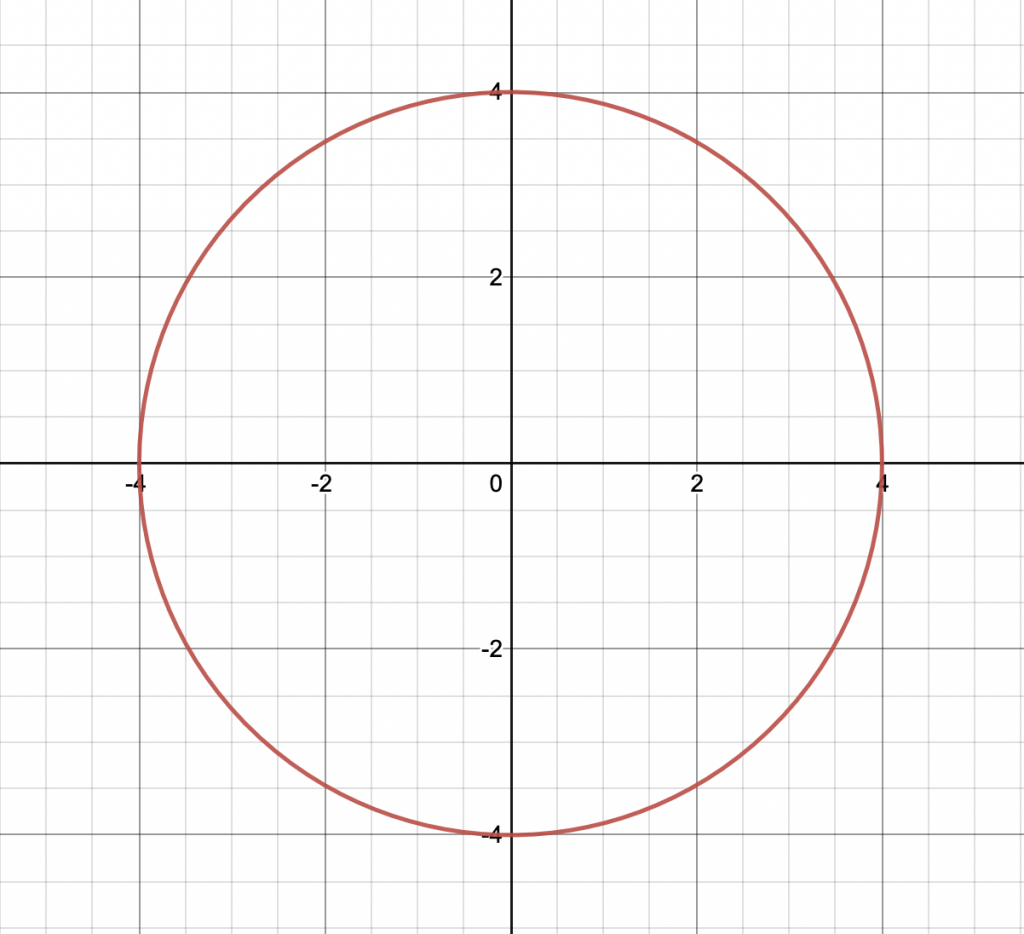
Non-Linear Equations
x2+y2=16
Domain: -4<x<4
Range: -4<y<4
I can tell from the graph because it doesn’t form a straight line it has a curve. I can tell from the equation because it isn’t in y=mx+b form.
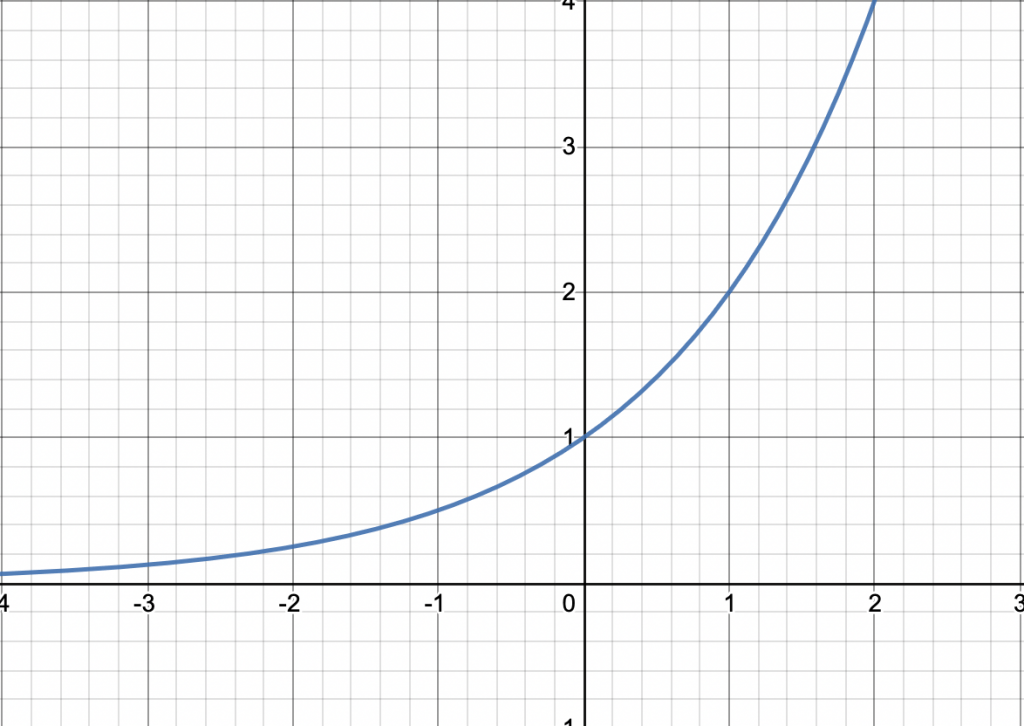
Non-Linear Equations
y=2x
Domain: 1>x>0
Range: 1>y>0
I can tell from the graph because it doesn’t form a straight line it has a curve. I can tell from the equation because it isn’t in y=mx+b form.
Self-Assessment
I explored mathematical ideas using technology when using desmos, desmos represented the equation in a graph form making it easier to understand the equation.
I analyzed data and used criteria to draw conclusions when I used desmos graphing the equations and analyzing if the belong in the Linear or Non-Linear Equations category.
I justified my conclusions with evidence when looking back at my note confirming the equations are Linear and Non-Linear.