
LINEAR EQUATIONS
Example 1:
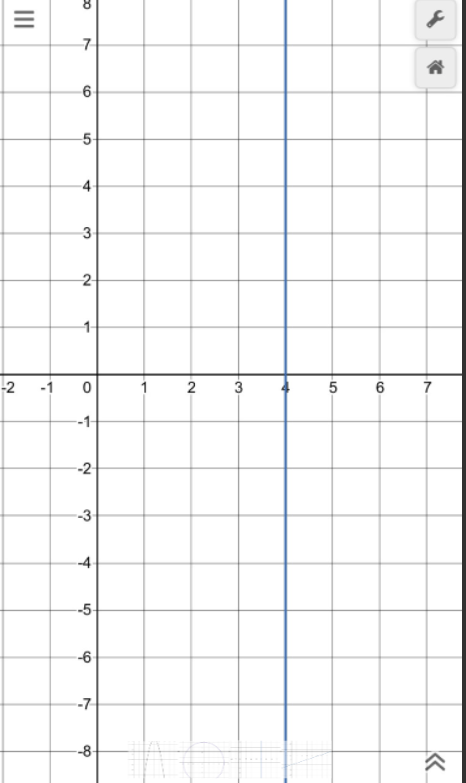
X = 4
This is a linear equation. I can tell from the graph because it is a straight line.
I can tell from the equation because all of the exponents are 1.
Example 2:
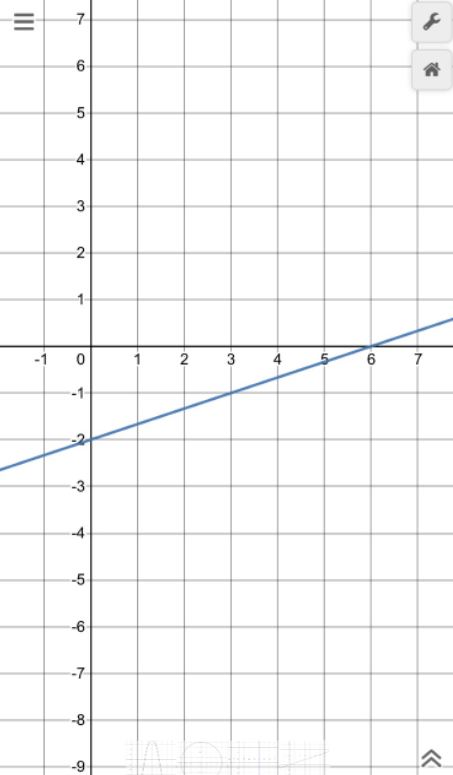
y = 1/3x – 2
This is a linear equation. I can tell from the graph because it is a straight line.
I can tell from the equation because all of the exponents are 1.
NON-LINEAR EQUATIONS
Example 1:
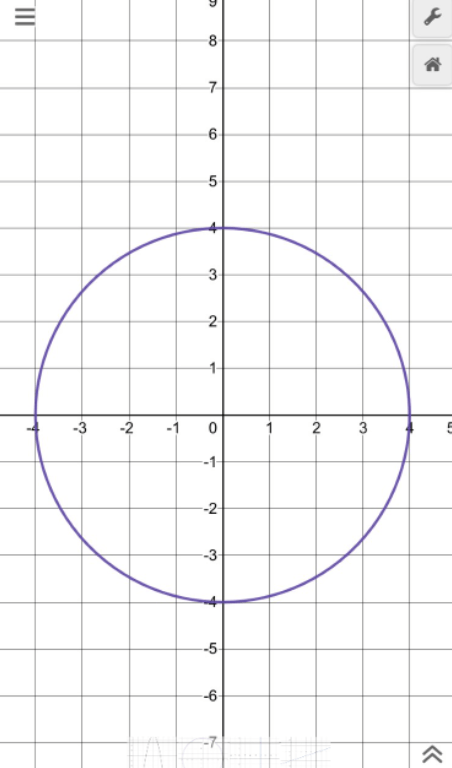
x2 + y2 = 16
This is a non-linear equation. I can tell from the graph because it is not a straight line.
I can tell from the equation because the x and y are squared, meaning the line wont be straight.
Example 2:
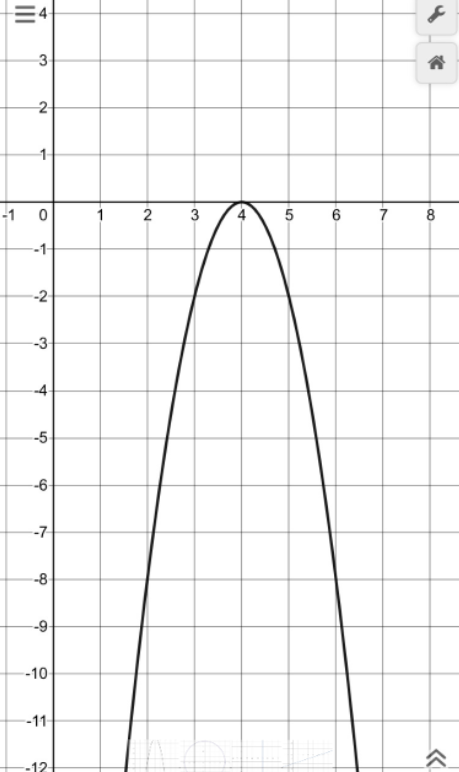
y = -2(x – 4)2
This is a non-linear equation. I can tell from the graph because it is not a straight line.
I can tell from the equation because the (x – 4) has an exponent of 2, which is squared.
SELF ASSESSMENT
I explored mathematical ideas using technology when I used desmos to make graphs with equations.
I analyzed data and used criteria to draw conclusions by looking at the equation/graph and knowing if it was linear or not.
I justified my conclusions with evidence when I explained why/how a graph is linear or non-linear.