I collaborated with three other people to write a script for this image in Spanish and presented it to the class. For writing this script, we all had different ideas and suggestions; we also had to write this script during a certain time. We were able to use communication skills and we wrote the script with cooperation and knowledge. We were capable of sharing all our opinions, using each other’s ideas and writing this script to the best of our ability. We could reach our goal and we were all very happy with the work that we presented. One of the things that I think we could’ve done better is to add more dialogue and conversations to the script.
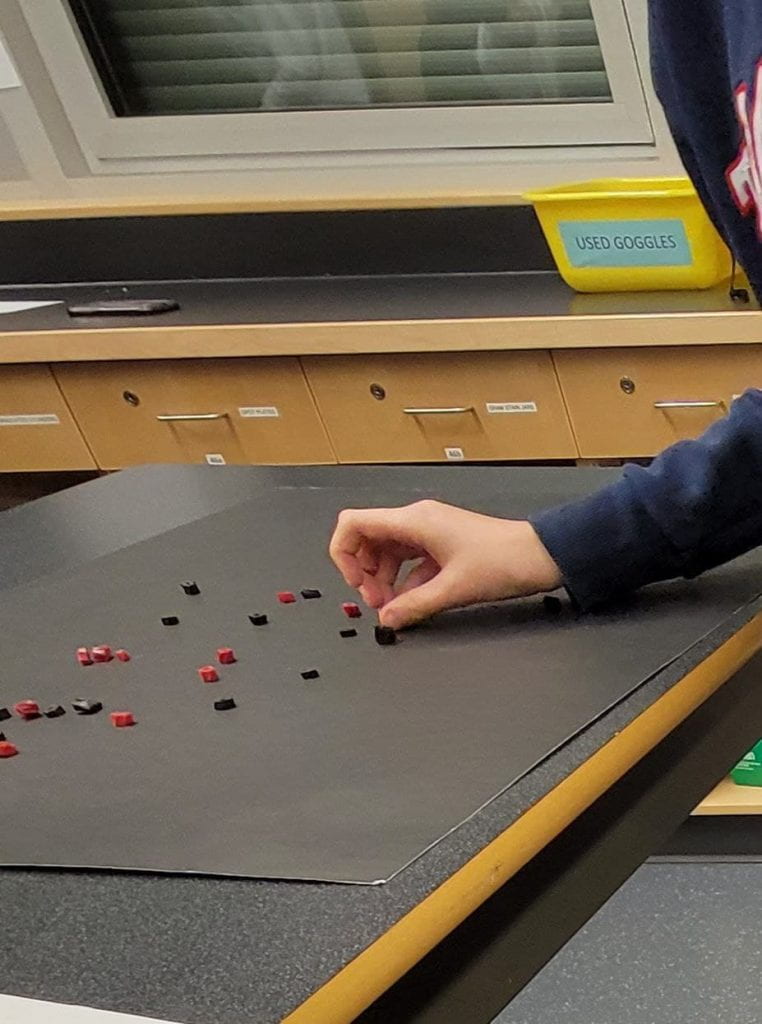
This is a picture of me collecting the red and black prey in the Natural Selection Lab
I demonstrated that I can collect and analyze evidence when I record the numerical data for each variable and organize them into a frequency table in both “The Natural Selection ” and “Feeding Frenzy” labs. During the “Feeding Frenzy” lab, my team members and I predicted the error ahead of the lab and tried our best to record accurate and unbiased data. Then, by organizing them into a frequency table for each variable which is the type of feeding tools in this lab, I gathered all the data. After all, in this lab, analyzing data by looking at the table and comparing the data together was accurate and easy. It goes the same for “The Natural Selection” lab, I record the data and organize them in a frequency table for collecting and analyzing data.
I demonstrated that I can connect evidence I collected to big ideas when I answer the follow-up questions based on my knowledge and connect them to the outside world. For both of the labs, there are some terminologies that are specific to those labs; first, I explain them, then I elaborate on what parts of the lab demonstrated that terminology or definition. This allows me to find varieties of examples in real life and open my mind to bigger ideas.
I demonstrated that I can make predictions based on evidence when I find real life examples and patterns in my lab. By finding the relation between data and variables, I can find a pattern and predict how it will happen in another laboratory environment. Moreover, by finding real life examples, I can connect it to real life and predict real life situations. For example, for a real life example in a “natural selection” lab, I can name frogs. Frogs have different colors depending on which environment they live in. They hide based on their colors on trees or on the ground to hide from the hunters (adaptation to environment). They are in competent with the other species over food which is insects (struggle for survival). They produce a lot of eggs so few of them at least can survive (overproduction of offspring). They also change in sizes and shade of color depends on the place they live (genetic variation). Based on the lab and data that we collect, we can say that the chance of survival for the prey in their same color environment is the highest. We can see the pattern in the lab here and by comparing it to a real life example, we can confirm that the pattern is the same and this happens in real life as well. Therefore, we can predict what will happen in similar situations.
I demonstrated that I can draw reasoned conclusions when I gather all previous information, all data, real life examples and their relations with each other. After knowing all basic information, terminologies and definitions, I consider a hypothesis. By looking at the purposes of the lab, I can make sure I am writing down an accurate hypothesis. Then, I record and track all data accurately. I organized them in a table for better analysis. Based on the follow-up questions and real life examples, I will find a pattern between my data and variables. In the end, by connecting all previous information, assumptions and researchers’ theories, I can draw reasoned conclusions. For example, in the “Feeding Frenzy” lab, I write a hypothesis such as a different feeding tool ends up with different results and survival rates for the person. I record the data by doing the lab and organize them in a table. Then, I answer the follow-up questions and think of a real life example. For a real life example, I think that the short giraffe that cannot eat the high leaves has a lower survival rate than the taller one. I also have basic information that feeding tools are important for survival and I know about the theory of “struggle for survival”. After collecting all the points and connecting them, I can draw a reasoned conclusion that the favorable traits that are adopted to the environment have a higher survival rate.
I chose Bill Nye because I saw him several times on his TV show and I wanted to learn more about him. He is an American television presenter, actor, scientist, and a writer.
For digital literacy we were told to write a few paragraphs on our digital footprint, and how it affects us, others, and our future. To begin, when I searched my name in google, I didn’t expect that I have any photos in google. As I predict, I didn’t have any photos in google. I am not active a lot in social medias and all of my accounts are private, so there are few selected people who can see my photos. Because I didn’t have any photos in google, it probably won’t have any impact until now on my future, my job or even my university.
There are different strategies that people can use to keep their digital footprint appropriate and safe. They can begin with having few social media accounts. Also, it is better for them to make it private and just allow selected people such as their family and their friends see their photos. Moreover, they should be aware about what they share. Every time that they post a photo, they should think what if another person and not their friends be able to see it; then they post the photo if they want. Also, the things that they post online can be seen by their family and friends, and if they post something inappropriate, the people who care about them might feel a different way about them after it.
I chose this photo because it is meaningful to me, it reminds me one of the best trips I’ve ever gone. I look this photo of Squamish. ” In photography , there is a reality so subtle that it becomes more real than reality.” -Alfred Stieglitz