Mar
2023
Cool Graph Featuring ADL Financial Literacy
I will put all of my money into stocks.
Calculations
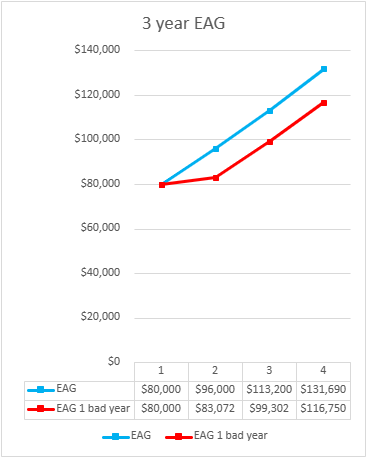
3 Year Stocks EAG
Year 1: 80,000 x 1.075 + 10,000= $96,000
Year 2: 96,000 x 1.075 + 10,000= $113,200
Year 3: 113,200 x 1.075 + 10,000= $131,690
3 Year Stocks: 3 Year EAG 1 bad Year
Year 1: 80,000 x 0.9134 + 10,000= $83,072
Year 2: 83,072 x 1.075 + 10,000= $99,302.40
Year 3: 99,302.40 x 1.075 + 10,000= $116,750.08
Justification
my group chose this option because of it’s fast results getting you a lot of money quickly and it’s dependance on skill making it more controlled to a degree, however if stocks drop in value your income will slow to a crawl making this option somewhat risky.
I am a somewhat high risk person which makes this option perfectly align with my risk tolerance because of it’s high risk and high reward.

Collaboration and Contributions
I should have contributed much more to this project because the other member of my group voluntarily did all the calculations and decision making while I slacked off, he even said that I did research in his own project to make me look better. Overall I would rate my ability to collaborate with my group a 0-4 and it’s entirely my fault.
CORE COMPITENCIE SHENANEGANS, MY FAVORITE!!!! (Insert excessive amount of sarcasm.)
I made a cool graph demonstrating my mastery of Microsoft Excel and cool graphs. I also now know how to use excel better. Yay!
I will try to contribute more on future projects. I will also try to communicate better on future projects.
I now have a better understanding of stocks and how they work.
I reflected on my own bad habits while making my cool graph featuring the rest of my project.