
Parent function -> 𝑦=𝑥^2
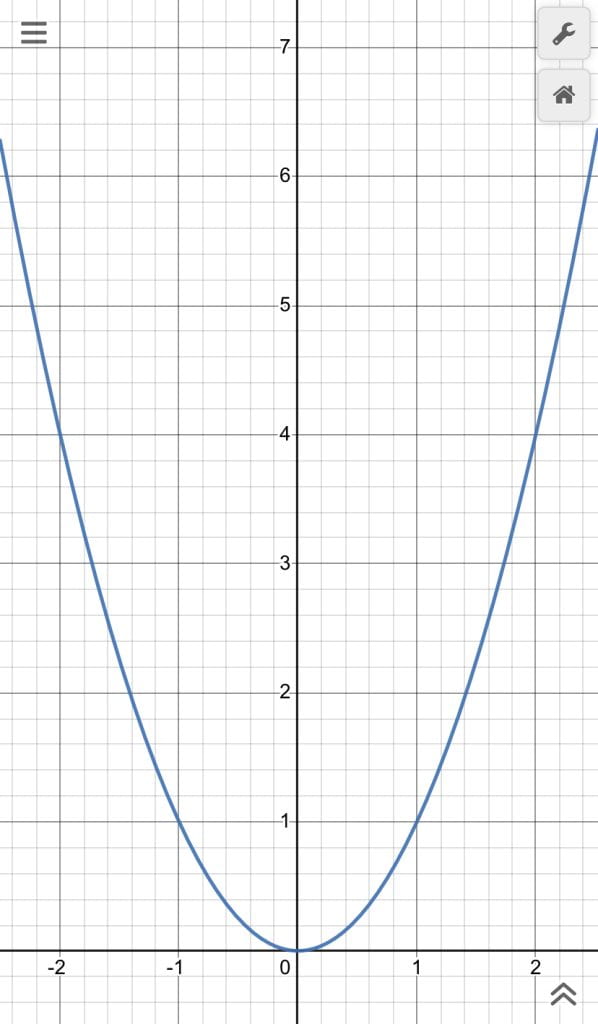
Vertex : (0,0)
Axis of symmetry : x=0
x intercept(s) : (0,0)
y intercept(s) : (0,0)
Domain: all real numbers
Range: y≥0
Minimum Value : 0
My equation -> 𝑦=4(𝑥+1)2−2

Vertex : (-1,-2)
Axis of symmetry : x=-1
x intercept(s) : (-1.7,0) (-0.29.0)
y intercept(s) : (0,2)
Domain: all real numbers
Range: y≥-2
Minimum Value : -2
COMPARISON

There’s plenty of ways where the parent function is different from my given equation and I will explain the different ways my parabola was transformed.
Starting with the “k” which transforms the parabola because it effects the vertical shift of the parabola .The value for my equation the “k” value is -2 which means the parabola shifts down by 2 as seen in the picture. This is different from the parent function because it doesn’t have a “k” value therefor the parabola doesn’t shift up nor down. Next, the “h” value for my equation which effects the horizontal shift of the parabola, in this case it’s +1 this means that the parabola shifts 1 to the left. This is different from the parent function because there is no “h” value in the equation therefor the parabola doesn’t shift to the left nor right, Also if my coefficient was -4 instead of 4 the parabola would flip upside-down but since its positive it shares something with the parent function in which both parabolas are going up. Finally the parabola from my equation is more compressed than the parabola of the parent function, this is because the bigger the value of the coefficient the more compressed the parabola will be, so since the coefficient 4 from my equation is bigger than 1 the coefficient from the parent function it explains why its more compressed.
SELF REFLECTION
1. Give an example from this assignment where you represented the same mathematical idea in multiple ways?
I represented the same mathematical idea with a visual representation, written, and numerically. First I used a visual representation by going to Desmos and plugging my different equation. My given equation and the parent function each had their own visual parabola, and then a separate one with both the parabola together for comparison. Then I wrote a paragraph about how the 2 different equations of the graph affected the difference between the parabolas. And finally to show the differences numerically I wrote the different components (range, domain, vertex, etc. of the 2 different parabolas under both graphs
2. Give an example from this assignment where you used mathematical vocabulary to demonstrate your understanding.
I used mathematical vocabulary when in my paragraph where I was explaining the difference between the 2 parabolas( vertical shift, horizontal shift, parent function, compress, transformation, coefficient.) I also used mathematical vocabulary when I was describing the different characteristics of the 2 parabolas. ( y intercept(s), vertex, axis of symmetry, x intercept(s), minimum value, domain, range.)
3. Give an example from this assignment where you used formatting to share the information in a clear and organized way.
I made the key titles bolded so it would be easier to read and more visually pleasing. I also made sure my different graphs were cropped properly and easy to see, and finally made sure my paragraphs were neatly spaced.