Research during this project was a large chunk of it, and during this process I found myself reading and rereading where and what sites my information was coming from. I wanted to ensure that all the information I added was accurate and thoroughly researched by an expert. However, I also didn’t want to be reading through a million different sources blindly either, so I looked for words and phrases that were common throughout the different sites and articles I was reading. This was something I had never done went researching for a project, but I seemed to find success and less stressed trying to find info. But I think next time I will try to filter the number of sites I’m using, as well as look for specific phrases and words.
during this project, I showed I can analyze text and draw conclusions from it. I can also think critically and show my ability to sort through information in front of me. I am able to demonstrate my thinking and problem-solving abilities through my research and overall presentation of my learning. I can show my refined thinking in my presentations and research-based projects that require an organized and open mindset.
The significant values in my equation are K, H, and A
The K value determines where on the y-axis my parabola will be shifted, for example in my equation my K value is -3 so I know my parabola will be 3 units below the x-axis. K is representative of the vertical shift of the parabola, if I had a positive 3, for example, I would move above the x-axis. This means that my parabola will open at -3, somewhere along the x-axis.
The A value in my equation will tell me which way my parabola will open and how the number representing the A value affects how my parabola looks. In my parabola my A value is a positive 1, which means my parabola will open upwards towards the positive numbers of the graph. But that’s not all, the A value can also affect your width. When a parabola has a large and positive A value the parabola is narrow and facing upwards; so when you have a smaller positive number the parabola is wider and up-facing. Also, when the A value is negative the widths of the values stay the same, but the direction in which they open changes to a down-facing parabola. In my parabola, the A value is a fraction (1/3) which is under one so using what we learned in class I know that my parabola is going to be wider than someone who has an A value of 2 or 3.
The H value shifts the parabola from left to right along the horizontal axis. If your H value is negative it will shift to the left, whereas if it’s positive it will shift to the right. But remember, the H value changes as you take it out of the brackets; lets say it was negative inside the brackets but as you take it out of the brackets it becomes a positive. This is a lot like my parabola, where the H value is positive inside but comes out as a negative 1, which shifts my whole parabola to the left.
Self-Assessment
1. Give an example from this assignment where you represented the same mathematical idea in three different ways?
I showed both the simple parabola and my own parabola side by side in a photo with both equations labelled. I also used mathematical words and terms that where used in class to get my point across.
2. Give an example from this assignment where you used mathematical vocabulary to demonstrate your understanding.
Any of the three paragraphs above are evidence of my mathematical vocabulary that was used in class.
3. Give an example from this assignment where you used formatting to share the information in a clear and organized way.
For this assignment, I utilised demos to help me visually graph my parabola. My parabola was plotted next to the original y=x^2 parabola, so I was able to distinguish the two. With this method, I was able to see the two graphs, which benefited me in comprehending the math. Additionally, I had to clarify my parabola, so I explained and showed my understanding for the various values. This also showed that I recognize what the variables stand for and how they are used in each equation. I also showed I am also able to recognize how each value effects the points on the graph.
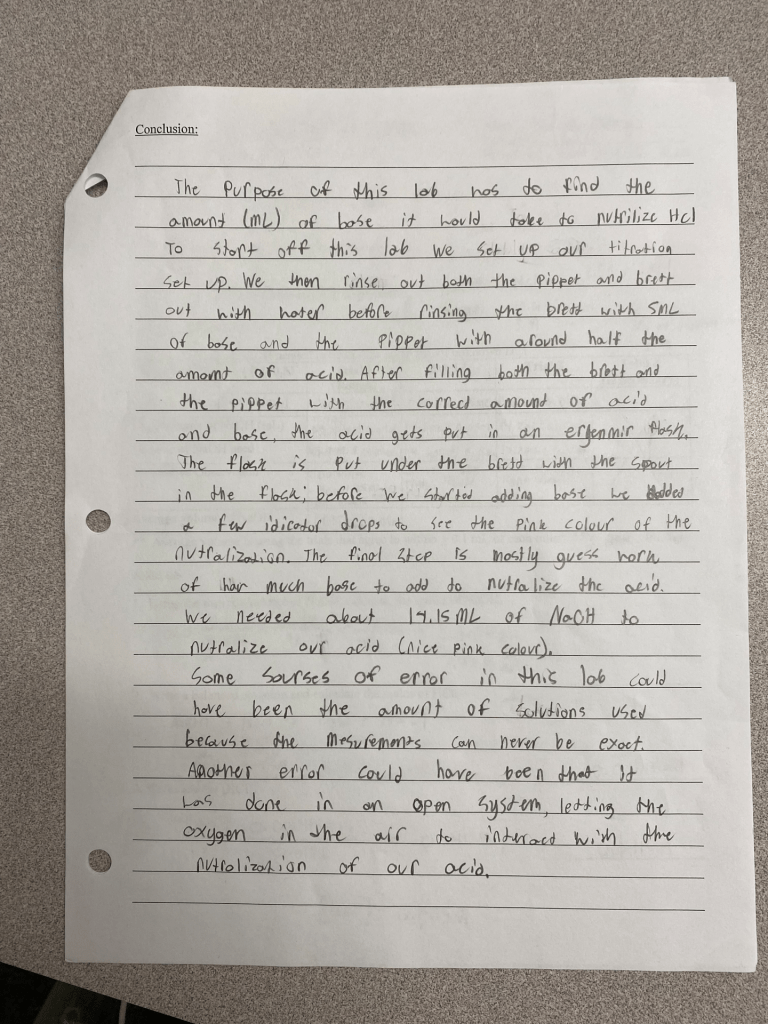
I demonstrate the ability to problem-solve and think critically about math and science problems. I can analyze information and what the question is asking me while thinking about my answer. Doing the conclusion allows me to reflect on my own thinking as well as the facts, which I think is important to note. A skill I gained from this activity was asking open-ended questions to gain valuable information. Another helpful thing was my budding ability to think critically about my answer and if it was correct or not based on the information I had learned in class. Being able to complete my thoughts and bring them to a close at the end of my labs, allows me to fully explain what I think and how much I’ve learned from the lab.
This is my artifact from my titration lab where I could fully explain and interpret how I took the information given to me. This conclusion was one of the ones I believe I did the best on because I enjoyed the lab. It was the kind of lab where you could make mistakes on and then build from them, which was something I could tie into my conclusion.