
Significance of my “K” “A” “H” Values
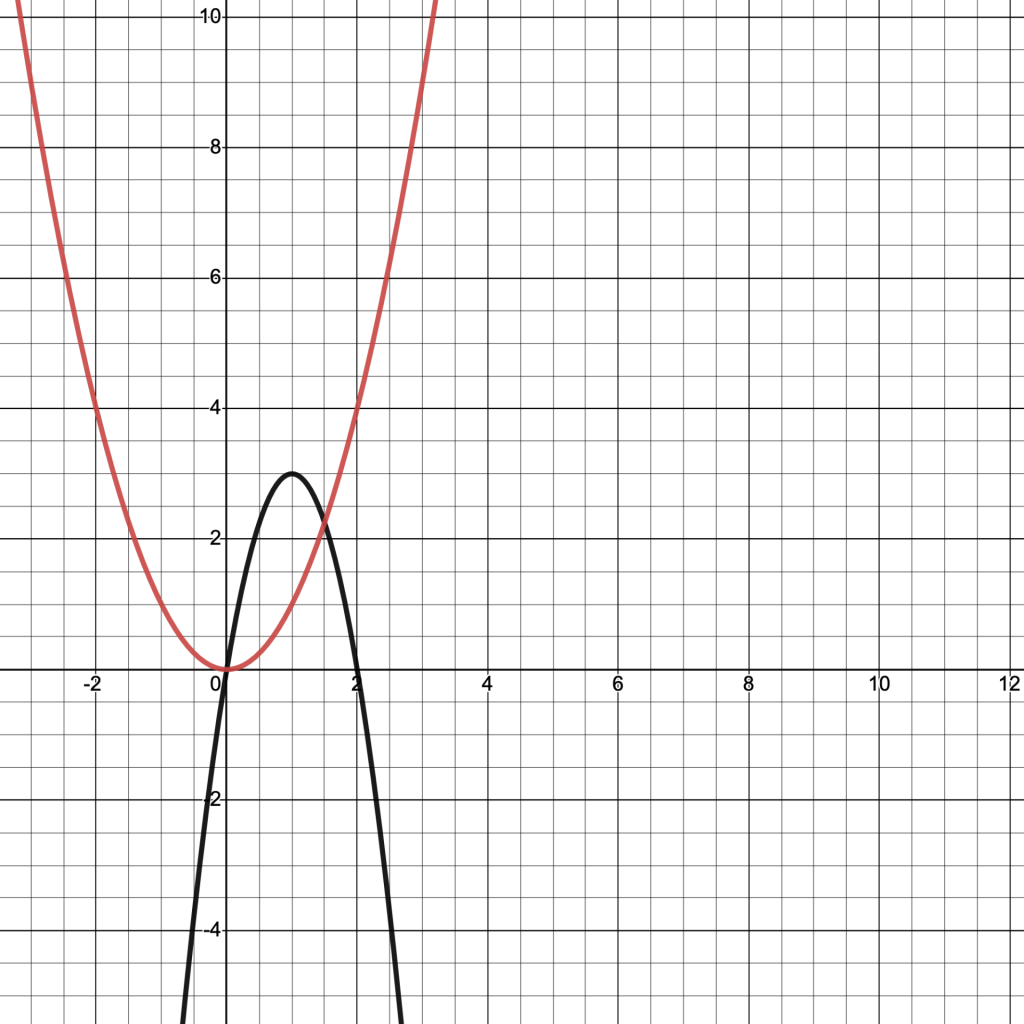
The “K” in a parabola equation determines the shift from the x-axis. If “K=3”, the parabola would be shifted three units up because it is also positive. If “K=-3” were negative, it would shift three units down from the x-axis. This represents the vertical shift. The “K” in my parabola is positive three, therefore it shifts up three units from the x-axis. The black parabola represents my parabola and it opens on the point of positive 3.
The “A” in a parabola affects the way the parabola opens. If “A=2”, the parabola opens upwards and if it were negative it would open downwards. In my parabola, the “A” is negative which allows it to open downwards. Depending on what the “A” value is, it also determines the width of the parabola. The width of -3 is bigger than -9 however that is only if it is negative. The width of a positive “A” value shrinks and a width of a negative “A” value widens.
The “H” shifts the parabola left or right. If “H=2” the parabola shifts two units to the right from the y-axis or if it was negative, it would shift two units left from the y-axis. This represents the horizontal shift. In my parabola, the “H” is -1 so it shifts to the left by one from the y-axis as it is negative.
A simple original parabola of y=x^2 does not have an “a” “h” or “k” value, therefore, there is no shift of any direction in the parabola. It opens up from the centre point of 0. Also since the equation is positive, the only way it would open is upwards
Self-Assessment
Give an example from this assignment where you represented the same mathematical idea in three different ways? (for example, as a graph, an equation and in words)
Give an example from this assignment where you used mathematical vocabulary to demonstrate your understanding.
Give an example from this assignment where you used formatting to share the information in a clear and organized way.
In this project, I used demos which helps graph my parabola so that I could visually see it. My parabola was graphed beside the original parabola of y=x^2. This way I can see the difference between the two and that helped as I was completing this assignment and understanding the math material. As well, I had to explain my parabola, so I broke down the different values and structures to demonstrate my understanding of what the variables mean and what they are for like explaining what the “H” value means or the “A” value. I also separated each of the different variable values in the equation into a different section, therefore, I can see which information fits with each. Also, a different colour between my parabola and the original one was used to distinguish which parabola is which. My parabola is black while the simple parabola is red.