Linear
x=4
Domain: Any real number
Range: Any real number

This is a linear equation. I can tell from the graph because it is a function and it is also a line. I can tell from the equation, because it is in the y=mx+b format.
Linear
y=1
Domain: Any real number
Range: y=1

This is a linear equation. I can tell from the graph because it is a function and it is also a line. I can tell from the equation, because there isn’t more then one variable and it is in the y=mx+b format.
Non-Linear
y=2x
Domain: 1>x>0
Range: 1>y>0
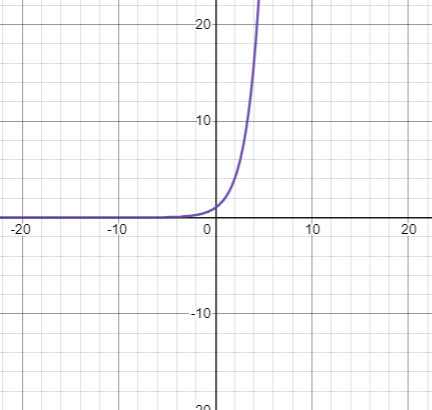
This is not a linear equation. I can tell from the graph because it is not shown as a line, it has a curve in it. I can tell from the equation, because it is not in the y=mx+b format.
Non-Linear
x2+y2=16
Domain: -4<x<4
Range: -4<y<4

This is/is not a linear equation. I can tell from the graph because it is not a function and it is not in a line. I can tell from the equation, because it is not in the y=mx+b format.
Self Assesment
I explored mathematical ideas using technology when I was using DESMOS. DESMOS helped me graph and visualize what the graphs look like, and then asses if the graph is linear, non-linear, a function, or not a function.
I analyzed data and used criteria to draw conclusions when I looked at the graphs that DESMOS gave me. I also analyzed data when I looked the the equations and checked if they were linear or non-linear.
I justified my conclusions with evidence when I checked in with me peers and compared our answers and checked if they were correct or if I needed to change them up a bit. I also looked back into my notes to remind myself of the rules and equations for graphing.