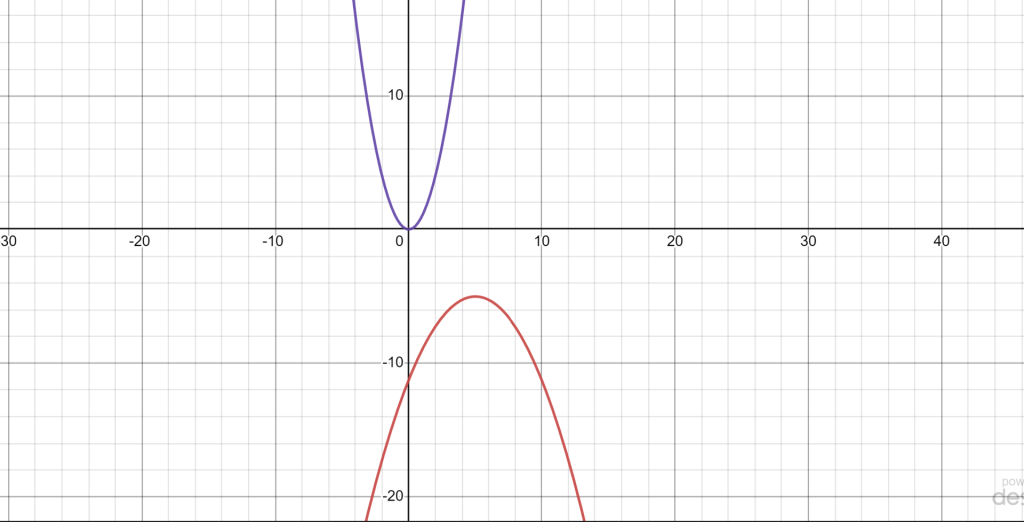
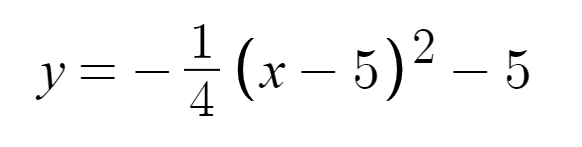
My Parabola:
Parabola Formula:
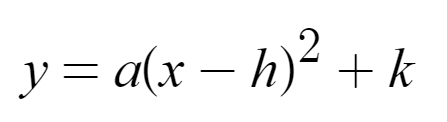
The parabola is affected in several ways by the variables “a,” “h,” and “k.” These variables all come from the parabola Formula, the variables correspond with the numbers above.
The parabola’s “a” value controls whether it widens or narrows and whether it opens upwards or downwards; in this case the parabola has a negative in front of the “a” value, therefore the parabola would open down. Due to the “a” value being -1/4 which is also less than zero, makes the parabola open wide.
If the parabola shifts to the left or right on the “x” axis, it all depends on the “h” value. The parabola will shift left if “h” is positive, and it would shift right if “h” is negative. In this case the “h” value is -5, therefore the “x” value would shift to the right due to it being 5, the “x” value of the vertex would be 5.
The “k” value determines whether the parabola shifts upward or downward. In this case the “k” value would be -5 meaning that the parabola would shift downward because it is negative. The “k” value is what determines the “y” part of the vertex, therefore meaning that the “y” part of the vertex would be -5.
Vertex=(5,-5)
A standard parabola is:
This is the most basic form of a parabola and this is due to the lack of variables and numbers. Specific parabola goes up 1 right 1, and continues. This parabola will never get more simplistic than this, therefore making this the corner stone of parabola’s.
Self-assessment
- By using my graph, paragraph, and equation, I was able to illustrate the same mathematical concept. For instance, I described the “a,” “k,” and “h” values in my paragraphs and provided visual support for them in the form of a graph and an equation.
- I utilised a lot of mathematical vocabulary in this assignment. To illustrate my point, I used terms like shifts right or left on the “x” axis or shifts upward or downward on the “y” axis when describing what the “h” and “k” values do.
- I created a clean and orderly graph of my two parabolas using the website Desmos. I then took a snapshot of the graph, removing the unnecessary border, and chose a scale that made it simple to identify amongst my parabolas.